Hot Air Balloons

Medium
Entertainment
Profitability
Public View

Practice with AI

Hone your skills by practicing this case with our AI-powered consultant.

TakeFlight offers all-inclusive hot air balloon rides in the American West. After doubling its flights, the company has failed to achieve the expected economies of scale. You are tasked with identifying cost-reduction strategies to grow profit margins and support future growth.

Client: TakeFlight Industry: Tourism / Experiential Entertainment Geography: American West TakeFlight sells all-inclusive hot air balloon rides. Each ride includes: • Watching the balloon inflate • Up to 15 passengers ride for approximately 1 hour • Car ride back from the landing zone to the starting point The entire process takes 3 hours. The business recently doubled from one ride to two rides twice per day.

Despite doubling its number of rides, TakeFlight has not experienced the expected economies of scale, profit margins have not improved. The company needs targeted strategies to grow margins and support future growth.
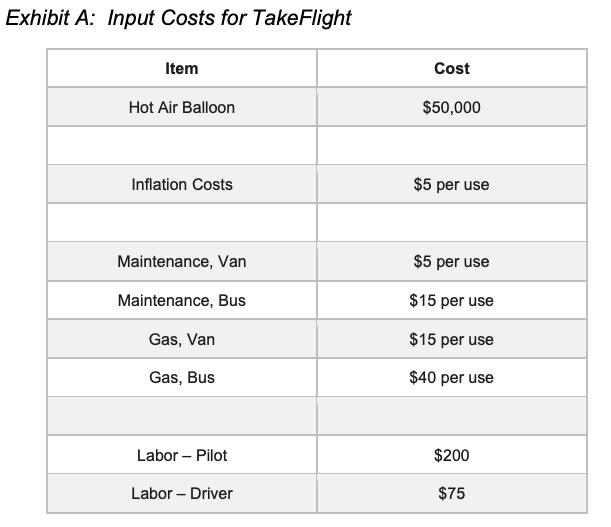
Input Costs for TakeFlight: Item Cost Hot Air Balloon $50,000 Inflation Costs $5 per use Maintenance, Van $5 per use Maintenance, Bus $15 per use Gas, Van $15 per use Gas, Bus $40 per use Labor – Pilot $200 Labor – Driver $75 Financial Benchmarks: Current margin: $500 per ride (10%). Target: $750 per ride (15%) after school bus implementation. School bus cost: $50,000. Payback: 200 rides = 100 flight days.
Exhibit 1
Q1 – Margin Expansion Factors
Investigate opportunities across two dimensions: pricing and costs.
• Pricing: Assess monopoly power, willingness to pay, per-person vs. per-ride pricing, and unbundling the all-inclusive package
• Fixed Costs: Number of balloons owned (3 including back-up), inflation devices (2 currently)
• Variable Costs: Fuel costs, pilot and driver labor, post-flight vehicle logistics
Recommended Approach:
Since pricing is optimal, focus on cost reduction — particularly in variable operating costs. Apply a chronological lens (pre-flight, in-flight, post-flight) to identify inefficiencies.
Q2 – Cost Reduction Opportunities
Key investigative questions:
• Do we own too many balloons? (No — 3 balloons with 1 back-up is appropriate)
• How many inflation devices do we have? (2, for simultaneous launches — cannot reduce)
• What about the post-flight return trip? Currently 4 vans used per flight (doubling from 2)
Insight:
Similar wind conditions mean both balloons land in roughly the same area, creating a consolidation opportunity for return vehicles.
Q3 – Return Trip Cost Savings
Vehicle consolidation options: 2 large vans, 1 large van, a school bus (optimal), or a limousine. The school bus yields the following savings per flight:
• Labor: 3 fewer drivers × $75 = $225 saved
• Gas: 4 vans ($60) vs. 1 bus ($40) = $20 saved
• Maintenance: 4 vans ($20) vs. 1 bus ($15) = $5 saved
• Total: $250 savings per flight
Q4 – School Bus Investment Analysis
A. New margin: $500 + $250 = $750 → 15% margin (a 50% improvement in margin rate)
B. Payback: $50,000 ÷ $250 = 200 rides ÷ 2 rides per day = 100 flight days. At 1 in 3 flight days, this pays off within a year.
Additional considerations: sell vans for quick cash; size bus for 33 seats (2 groups + 1 driver + 2 pilots); consider a larger bus to accommodate future growth.

Practice Sessions

No practice sessions have been proposed yet. Be the first to propose one!

Note: Accepted practice sessions will be available in your profile under "My Practice Sessions".

Case Materials

Submissions (0)

Sort by:

Be the first to comment on this case.

Published July 6, 2025 • 26 views
Firm/University: University of Notre Dame
No ratings yet
0