
U.S. Shoe Manufacturing
Practice with AI
Hone your skills by practicing this case with our AI-powered consultant.
A major U.S. shoe manufacturer currently produces its entire product line domestically and is feeling the squeeze of rising labour costs and growing competitive pressure. The company wants to know whether it should move some or all of its production offshore, where it should go, and in what proportions it should split manufacturing between domestic and overseas facilities. The case works through a structured framework, a unit profitability calculation, and a quantitative model for determining the optimal offshore split.
A major U.S. shoe manufacturer is currently manufacturing its entire product line domestically. Because of increased labor costs and competitive pressure, the manufacturer is now interested in understanding whether it should offshore some or all of its production and, if so, where it should offshore to and what percent of its total product line should be manufactured onshore vs. offshore. What factors should the client consider as it compares onshore to offshore manufacturing?
The client is a large U.S.-based shoe manufacturer that also produces some apparel. It currently sells into developed markets across North America, Europe, and Australia. All manufacturing is done domestically at present. Most of the client's competitors have not yet offshored production, citing manufacturing complexity and managerial challenges as deterrents. Outside the U.S., lower-quality shoes tend to be produced in China, Southeast Asia, and Central America, whilst higher-quality production is concentrated in Eastern Europe. The client has begun assessing a manufacturing partner based in Vietnam as a potential offshore destination. The core tension in this case is straightforward: domestic production is becoming increasingly costly, but offshoring introduces a different set of risks and costs around quality, transportation, tariffs, lead times, and working capital. The client needs a rigorous framework to decide what to do.
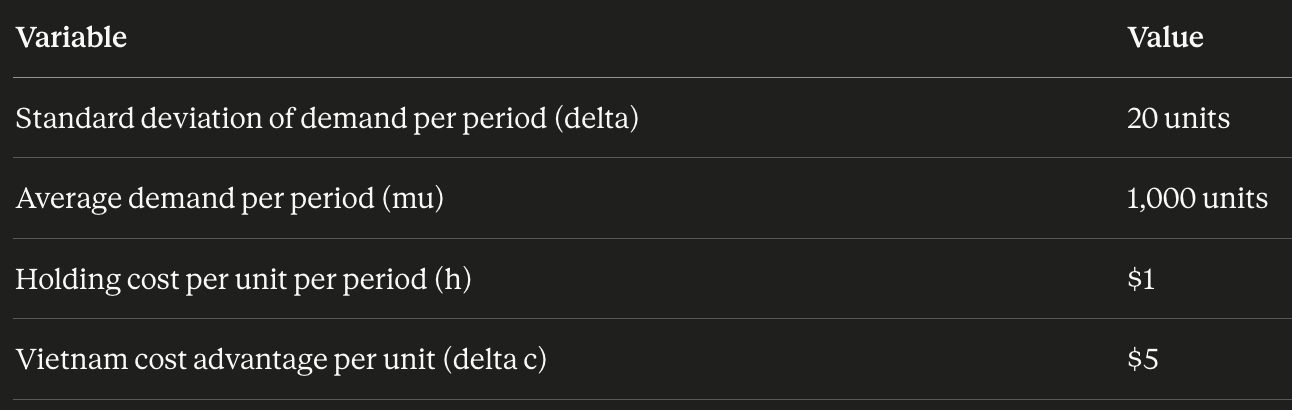
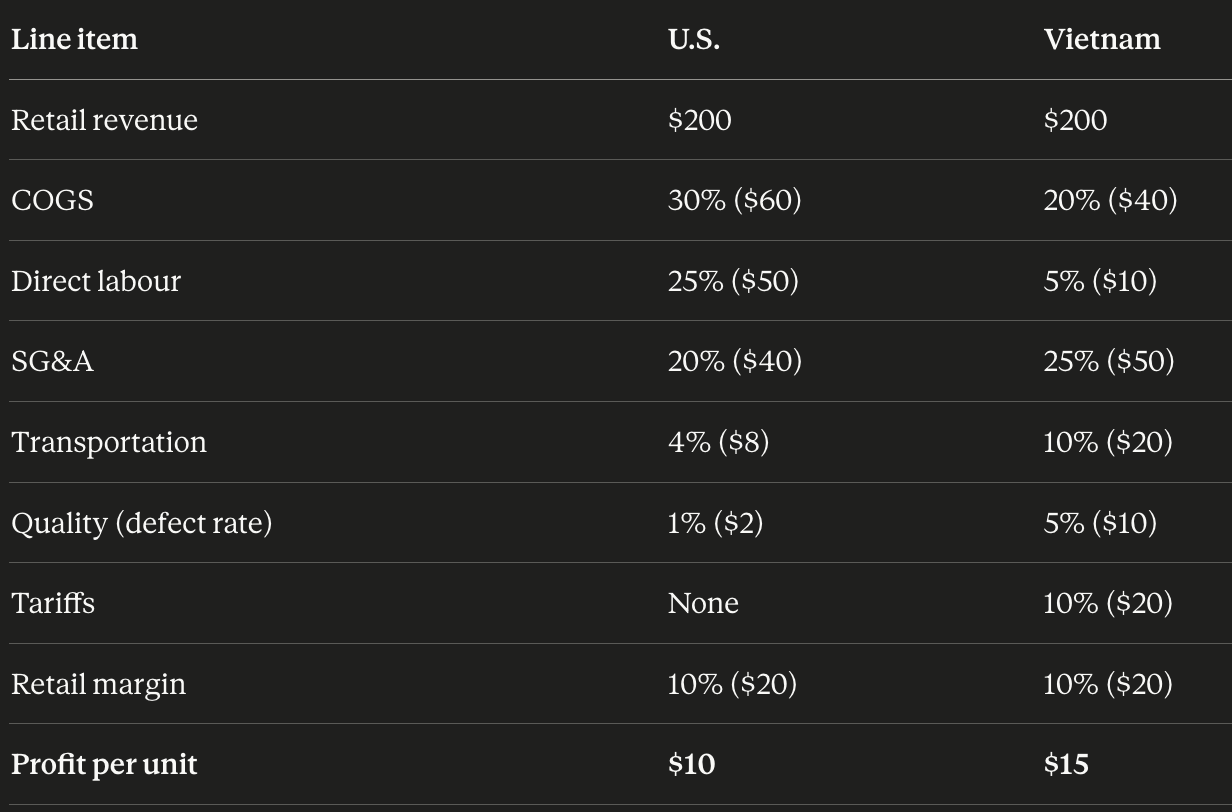
This case has three distinct analytical phases that build on each other. A strong candidate needs to move fluidly between qualitative reasoning and numerical work. Phase 1: Framework for the offshoring decision Organise the analysis across demand, supply, technology, and macroeconomic dimensions. The key insight to draw out here is that offshoring is not purely a labour cost arbitrage decision. It also involves supply chain risk, quality control, regulatory exposure, and lead time consequences. The fact that most competitors have not yet offshored is worth flagging as a signal that the complexity is real, not just a perception. Phase 2: Unit profitability analysis Work through the per-unit calculation cleanly. Vietnam comes out at $15 profit per unit against $10 in the U.S., a $5 per unit advantage. The candidate should be able to identify where that advantage comes from (lower COGS and labour) and where it is eroded (higher SG&A, transportation, tariffs, and a much worse defect rate). The quality gap in particular deserves attention: at 5% versus 1%, a further deterioration in Vietnam quality could flip the economics back in favour of domestic production. Similarly, tariffs and transportation costs are macroeconomically sensitive and could shift meaningfully with changes in trade policy or fuel costs. Phase 3: Total landed cost and the dual-sourcing model The introduction of the three-month lead time from Vietnam is the pivot point in the case. A longer lead time means the company must commit to orders further in advance, which forces it to hold more inventory to cover demand uncertainty. This is where working capital enters the picture. The candidate should identify that average demand, demand volatility, and holding costs all need to be added to the model to capture the true cost of sourcing from Vietnam. Once those factors are incorporated, the offshoring formula produces an answer of 80% Vietnam and 20% U.S. The logic behind this split is that Vietnam handles the predictable base level of demand, where its cost advantage is clear, whilst the U.S. facility covers the uncertain portion of demand that cannot be committed to three months in advance without carrying excessive inventory risk. Final recommendation: The client should manufacture 80% of its shoes in Vietnam and retain 20% of production in the U.S. as a hedge against demand volatility. The $5 per unit cost advantage in Vietnam holds up under the current assumptions, but the client should closely monitor quality trends, tariff changes, and demand volatility, all of which could shift the optimal split back towards domestic production. As a follow-on, the client should run sensitivity analyses across these three variables to understand how robust the 80/20 split is under different scenarios.
Practice Sessions
Note: Accepted practice sessions will be available in your profile under "My Practice Sessions".
Case Materials
Submissions (0)
Be the first to comment on this case.

Practice with AI
Sharpen your skills by practicing this case with our AI-powered consultant.
Practice Sessions
Note: Accepted practice sessions will be available in your profile under "My Practice Sessions".