
Specialty Pharma
Practice with AI
Hone your skills by practicing this case with our AI-powered consultant.
A specialty pharmaceutical company has experienced a dramatic EBITDA margin collapse — from 28% to 13% over three years — despite strong revenue growth from $400M to $560M. The candidate must identify the drivers of rising costs and recommend corrective actions. This is a profitability case with a life sciences context, requiring clean cost decomposition and synthesis.
Client: A specialty pharma company operating in the branded/differentiated therapeutics space. Situation: Revenue has grown meaningfully over three years, yet profitability has more than halved. Leadership is concerned and has hired the consulting team to diagnose the issue. Firm context: L.E.K. Consulting — candidate-led format. Life sciences and PE due diligence are core L.E.K. sectors. Timeframe: Three-year performance window being analyzed.
The client's EBITDA margin has declined from 28% to 13% over three years, even as revenue grew from $400M to $560M. In absolute terms, EBITDA has fallen from $112M to $72.8M — a drop of ~$39M — despite $160M in additional revenue. The company is spending more than $1.25 for every $1.00 of incremental revenue generated. The core question is: what is driving this cost overrun, and how should it be addressed?
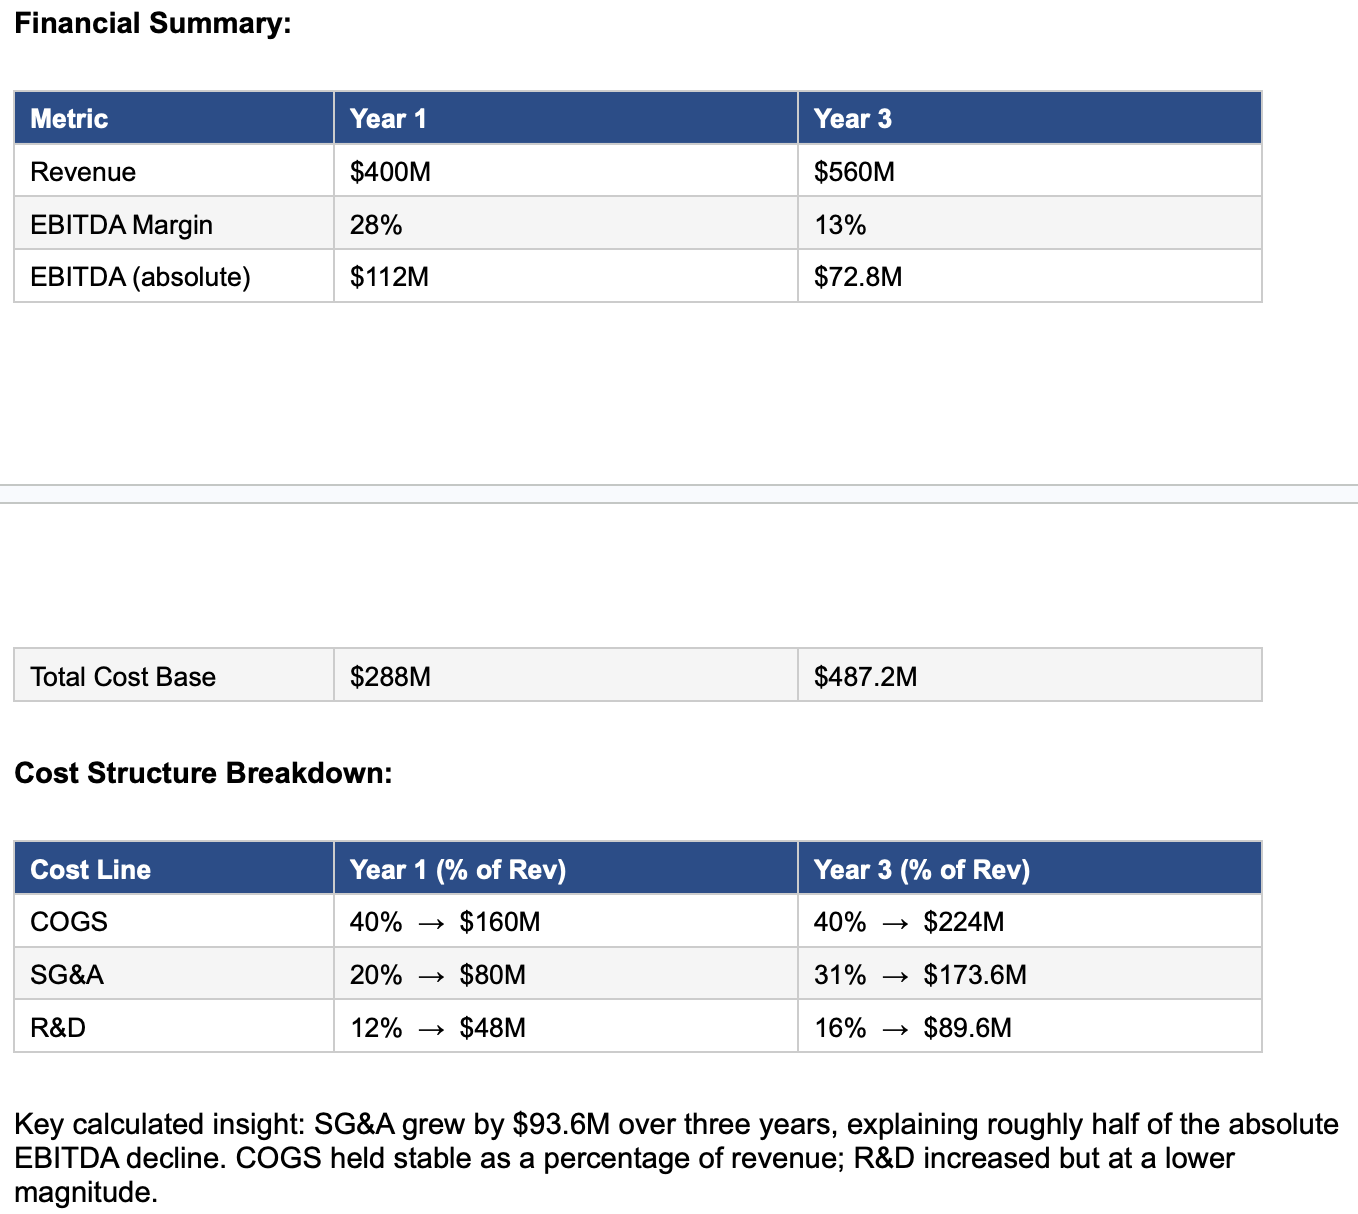
Step 1 — Quantify: Anchor the analysis with absolute EBITDA and cost figures before diagnosing. Year 1: $112M EBITDA on $288M costs. Year 3: $72.8M EBITDA on $487.2M costs. Cost grew $199.2M to generate $160M in revenue — confirming cost is the core issue, not revenue shortfall. Step 2 — Decompose: Break the cost base into COGS (variable), SG&A (semi-fixed), and R&D (investment). Apply the provided percentages to isolate which line is out of control. Step 3 — Diagnose root cause: SG&A is the primary driver — it grew from 20% to 31% of revenue (+$93.6M), roughly half the total EBITDA loss. The hypothesis: over-expansion of the commercial/sales organization without proportional revenue return. Step 4 — Recommend: Conduct a SG&A efficiency audit focused on sales force productivity by territory. Benchmark versus the pharma peer median (~20–22% of revenue). Identify and restructure or exit the lowest revenue-per-rep territories. Separately, evaluate R&D portfolio for low-priority spend that can be deferred or cut. Final recommendation (synthesis-ready format): The core issue is SG&A over-expansion — the company added $93.6M in selling costs while generating $160M in revenue growth. I recommend a SG&A efficiency audit benchmarked against the pharma peer median of 20–22% of revenue. The immediate lever is a territory-level productivity analysis to identify and restructure the lowest-performing markets. If SG&A returns to 22% of Year 3 revenue, that alone recovers ~$50M in EBITDA — restoring margin above 20%.
Practice Sessions
Note: Accepted practice sessions will be available in your profile under "My Practice Sessions".
Case Materials
Submissions (0)
Be the first to comment on this case.

Practice with AI
Sharpen your skills by practicing this case with our AI-powered consultant.
Practice Sessions
Note: Accepted practice sessions will be available in your profile under "My Practice Sessions".