
Health Insurance
Practice with AI
Hone your skills by practicing this case with our AI-powered consultant.
FitCo, a rapidly growing health insurer, has expanded into new markets through government subsidies but has seen profitability drop sharply over three years. You must identify the root cause and develop strategies to restore profits to prior levels.
Client: FitCo Industry: Health Insurance Growth Profile: Rapid expansion; customer base doubled in 5 years (1M → 2M) FitCo has grown rapidly by leveraging government subsidies to enter new markets. Despite doubling its customer base, profitability has dropped sharply. The CEO wants to understand what went wrong and how to fix it.
FitCo's profits have declined significantly despite revenue holding constant and customer growth. Identify the root cause and recommend strategies to restore absolute profits to prior levels.
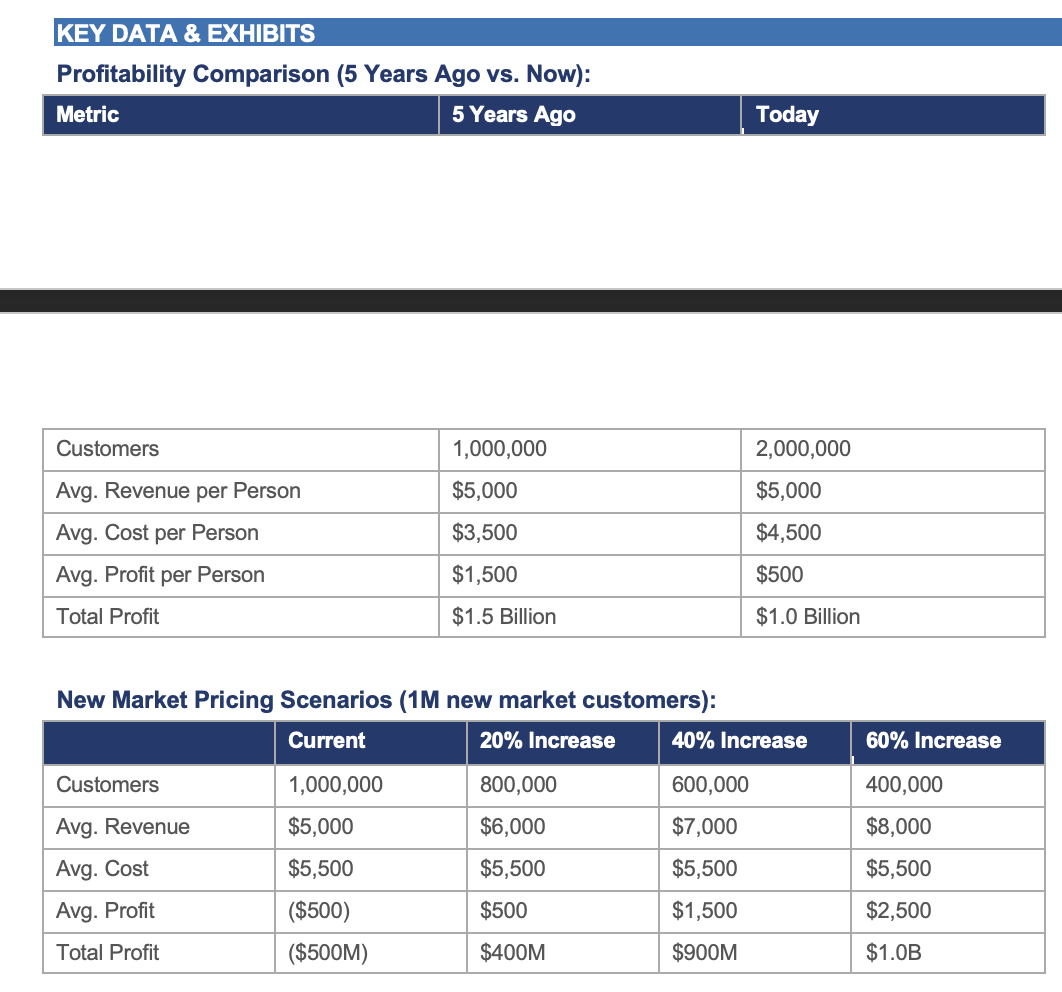
Q1 – Diagnosing Declining Profitability Investigate across three dimensions: • Revenue decline: Did new markets bring in lower-paying customers? Did FitCo underprice to win market share? Did regulation cap premiums? • Cost increase: Were subsidies temporary? Are new market customers costlier to acquire or sicker? Are administrative costs higher in new markets? • Market structure: Has FitCo's model hit a scaling ceiling? Are regulatory dynamics distorting expansion strategy? Hypothesis: Since revenues are flat, scaling is unlikely to reduce revenues — but it may have bloated costs. Focus investigation on cost dynamics in new markets. Q2 – Quantitative Profitability Analysis Part A — Profitability change: • 5 years ago: $1,500 × 1M customers = $1.5B • Today: $500 × 2M customers = $1.0B • Difference: $500M decline Part B — Required cost reduction to restore profits: • Target: $1.5B ÷ 2M customers = $750 avg. profit per person • Current avg. profit: $500 → need $250 more per person • Required avg. cost reduction: $250 per person (from $4,500 to $4,250) Key insight: The $250 required reduction is modest compared to the $1,000 increase in costs over 5 years. Revenue-side increases could also achieve this target. Q3 – Strategies to Grow Margins Key insight: If half of customers come from new markets and average cost rose by $1,000, the new markets must be operating at a loss. Segment the data. • Leave unprofitable new markets: Exit markets where long-term margins are negative • Raise prices: Model price elasticity; evaluate government-imposed price change limits • Cut costs: Incentivize healthier behaviors, assess start-up costs vs. ongoing care costs, review local regulatory compliance costs • Seek subsidies: Determine whether government subsidies were included in current margin calculations Q4 – Optimal Pricing in New Markets New market details: 1M customers, revenue = $5,000, cost = $5,500 (operating at a loss). For every 20% price increase, 20% of customers are lost. Optimal recommendation: 40% price increase yields $900M total profit — equivalent to the $1,500 margin in original markets. It avoids the reputational and regulatory risk of a 60% increase while capturing nearly the same profit as the 60% scenario. Beyond-profit considerations: • Government regulation may cap annual price increases • Brand image: large price hikes could signal exploitation • Customer pool risk: losing healthier customers leaves a costlier insured base • Grandfathering obligations for existing customers
Practice Sessions
Note: Accepted practice sessions will be available in your profile under "My Practice Sessions".
Case Materials
Submissions (0)
Be the first to comment on this case.

Practice with AI
Sharpen your skills by practicing this case with our AI-powered consultant.
Practice Sessions
Note: Accepted practice sessions will be available in your profile under "My Practice Sessions".